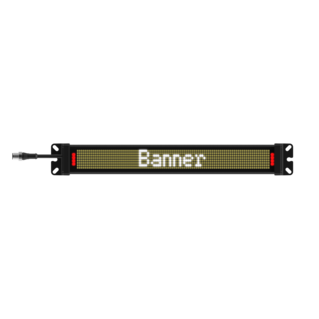
Série d’afficheurs d’état SD50
Grâce à son texte facilement configurable et à ses LED multicolores, l’afficheur d’état SD50 transmet rapidement et clairement des informations essentielles là où elles sont les plus utiles.
Watch this video to learn how to use the SD50 Status Display in Measure mode, using Pro-Editor software.
This is a quick How-To video that will cover the basics of configuring the measurement mode for the SD50 status display from Banner Engineering.
Begin by connecting the SD50 to your Windows PC using the Pro Converter Cable Kit, and by following the diagram in the manual.
If you're having trouble connecting, check out our troubleshooting guide for the Banner Pro Editor software.
Once you have connected to the software, click the measurement icon.
Measurement mode takes a pulse width modulated or pulse frequency modulated signal into the white wire or pin 2, and updates the status of the display based on custom thresholds.
The first setting you will want to modify is the signal type that you will be sending to the display, which can be set via the PWM/PFM menu.
For this example, we are using a Q4X laser measurement sensor with a pulse frequency modulated output, so we will set the signal type to PFM.
Next, set the frequency range via the PFM low and high fields.
The filter and hysteresis menus can be used at the signal coming into the display is subject to signal noise or chattering, to help reduce the effects on the display's output.
The next settings that are important to address are the output scale value fields.
This is where you can set specific numerical values to the PFM high and low values to match your application.
The Q4X in this example has a range of 25 to 100mm, so we will set these values to be 25 and 100.
Measurement mode also includes the option to provide a bar graph on the display.
The display bar graph checkbox is selected by default, and it can be unchecked if you only want to display text.
You can also change the orientation of the bar graph by selecting the number in the bar graph orientation menu that corresponds with the specific side of the display shown in the figure to the right.
For example, if the orientation is set to side 3, the bar graph will fill from that side of the display.
Additional bar graph settings include showing the bar graph only, and displaying a slim bar graph.
Below these settings are the data label and value label fields.
Here you can assign text that can provide context to your measurement.
You may also choose the number of decimal places that you wish to show, with three decimal places being the maximum.
You can configure up to four different states, and you can set each state to trigger at a specific threshold using the percent menus.
Each state can be configured to show one of seven animations with 14 color options, as well as a unique line of text.
It's important to note that any text entered in the display text fields will supersede the data label field.
Leave the field blank if you wish to keep the data label displayed.
When you are finished selecting an animation and text for each state, click Write Device Settings to send the configuration to the SD50.
Additional formatting options are available in the Advanced Settings menu, including text color, text brightness, scroll direction, connector orientation, and more.
Click Write to send these settings to the SD50.
That covers the basics of the SD50 measurement mode. For more information, reach out to Banner Engineering.